Table Chart
Table charts display raw data in rows and columns.
| Features | Quantity | Notes |
|---|---|---|
| Required Dimensions | 0+ | No dimensions required, unlimited number of dimensions. |
| Required Measures | 0+ | No limit. Strings must be dictionary encoded (countable). |
You can display individual data rows, or use grouping or aggregation. There is no limit for dimensions or measures on Table charts. You can view more aggregated measures in a table chart than most other chart types.
Null Order
You can choose whether to display null values at the top or bottom of the table.
Custom Measure Formatting
You can also use custom measure formats for the value in your chart. See Customizing Measure and Date Formats.
Table Chart Examples
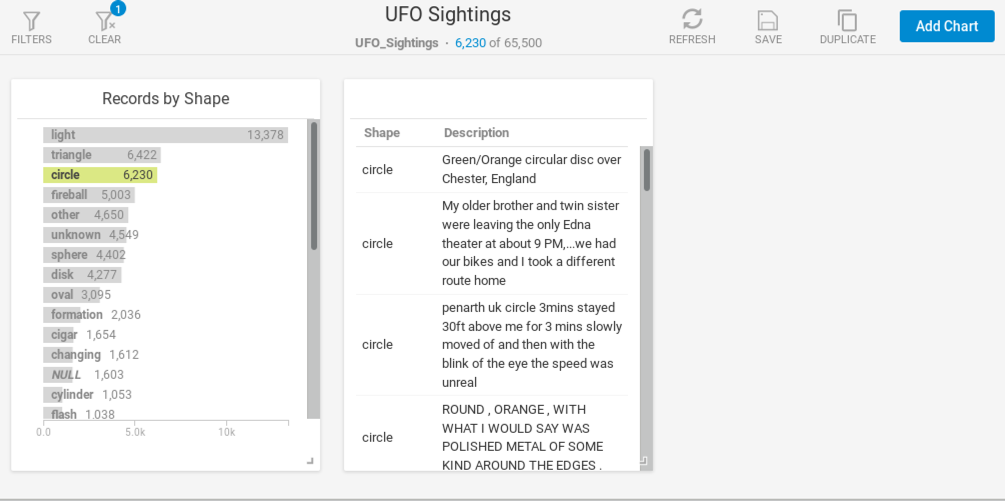
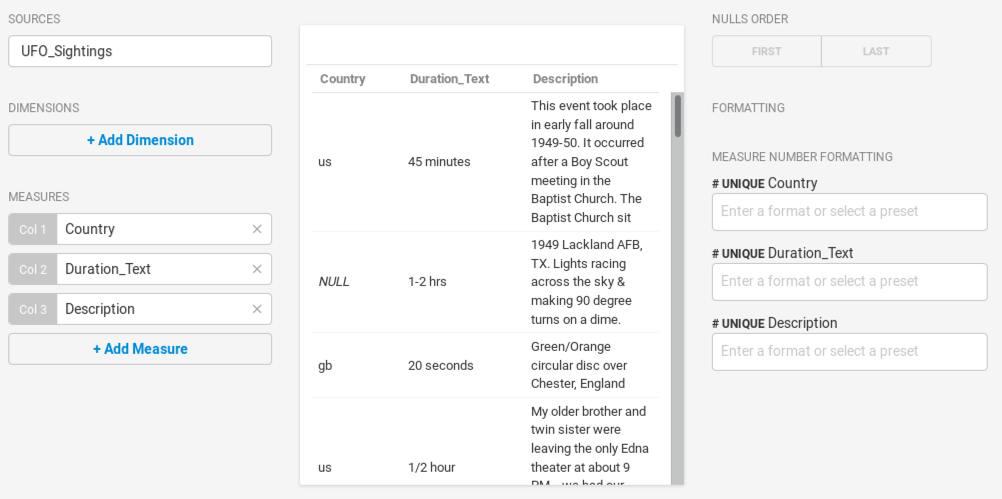
Create a new Table chart. Choose a Data Source. This example uses the official database of UFO sightings. You can create a Table chart using only measures, to display all sightings individually.
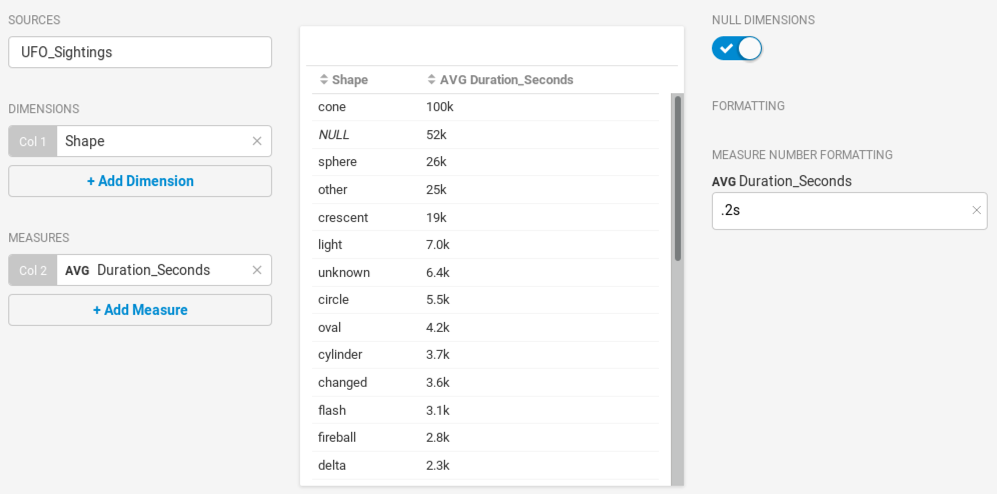
You can also use Table charts to group information by a dimension, similar to other chart types. For example, add the shape dimension, and you can display the average duration in seconds for UFOs of that shape. In a grouped chart, you can sort on any column in ascending or descending order. You can format the measures you use to make them easier to scan.
On a dashboard, you can click a dimension in a separate chart to show detailed records for that dimension in a Table chart.