OmniSci Overview
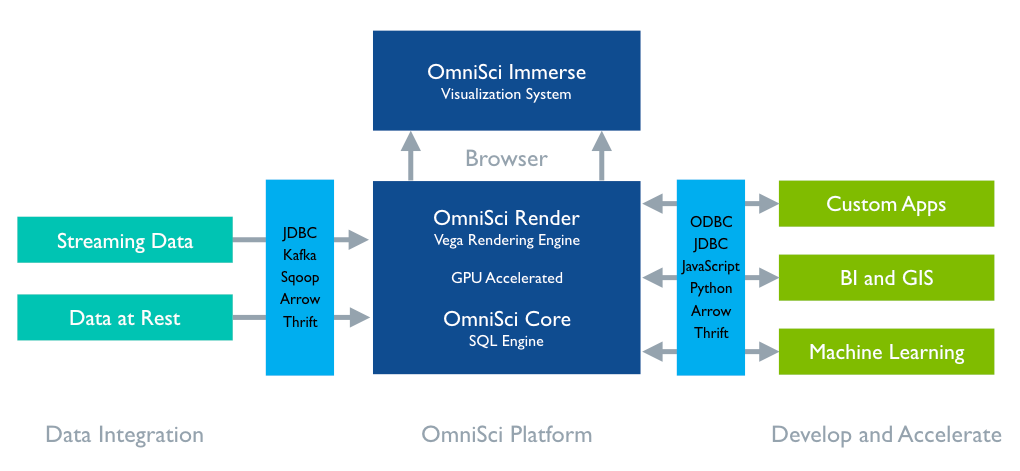
OmniSci is an analytics platform designed to handle very large datasets. It leverages the processing power of GPUs alongside traditional CPUs to achieve very high performance. OmniSci combines an open-source SQL engine (OmniSci Core), server-side rendering (OmniSci Render), and web-based data visualization (OmniSci Immerse) to provide a comprehensive platform for data analysis.

OmniSci Core
The foundation of the platform is OmniSci Core, an open-source, GPU-accelerated database. OmniSci Core harnesses GPU processing power and returns SQL query results in milliseconds, even on tables with billions of rows. OmniSci Core delivers high performance with rapid query compilation, query vectorization, and advanced memory management.
Native SQL
With native SQL support, OmniSci Core returns query results hundreds of times faster than CPU-only analytical database platforms. Use your existing SQL knowledge to query data. You can use the standalone SQL engine with the command line, or the SQL editor that is part of the OmniSci Immerse visual analytics interface. Your SQL query results can output to OmniSci Immerse or to third-party software such as Birst, Power BI, Qlik, or Tableau.
Geospatial Data
OmniSci Core can store and query data using native Open Geospatial Consortium (OGC) types, including POINT, LINESTRING, POLYGON, and MULTIPOLYGON. With geo type support, you can query geo data at scale using special geospatial functions. Using the power of GPU processing, you can quickly and interactively calculate distances between two points and intersections between objects.
Open Source
OmniSci Core is open source and encourages contribution and innovation from a global community of users. It is available on Github under the Apache 2.0 license, along with components like a Python interface (pymapd) and JavaScript infrastructure (mapd-connector, mapd-charting), making OmniSci the leader in open-source analytics.
OmniSci Render
OmniSci Render works on the server side, using GPU buffer caching, graphics APIs, and a Vega-based interface to generate custom pointmaps, heatmaps, choropleths, scatterplots, and other visualizations. OmniSci enables data exploration by creating and sending lightweight PNG images to the web browser, avoiding high-volume data transfers. Fast SQL queries make metadata in the visualizations appear as if the data exists on the browser side.
Network bandwidth is a bottleneck for complex chart data, so OmniSci uses in-situ rendering of on-GPU query results to accelerate visual rendering. This differentiates OmniSci from systems that execute queries quickly but then transfer the results to the client for rendering, which slows performance.
Geospatial Analysis
Efficient geospatial analysis requires fast data-rendering of complex shapes on a map. OmniSci can import and display millions of lines or polygons on a geo chart with minimal lag time. Server-side rendering technology prevents slowdowns associated with transferring data over the network to the client. You can select location shapes down to a local level, like census tracts or building footprints, and cross-filter interactively.
Visualize with Vega
Complex server-side visualizations are specified using an adaptation of the Vega Visualization Grammar. OmniSci Immerse generates Vega rendering specifications behind the scenes; however, you can also generate custom visualizations using the same API. This customizable visualization system combines the agility of a lightweight frontend with the power of a GPU engine.
OmniSci Immerse
OmniSci Immerse is a web-based data visualization interface that uses OmniSci Core and OmniSci Render for visual interaction. Intuitive and easy to use, OmniSci Immerse provides standard visualizations, such as line, bar, and pie charts, as well as complex data visualizations, such as geo point maps, geo heat maps, choropleths, and scatter plots. Immerse provides quick insights and makes them easy to recognize.
Dashboards
Use dashboards to create and organize your charts. Dashboards automatically cross-filter when interacting with data, and refresh with zero latency. You can create dashboards and interact with conventional charts and data tables, as well as scatterplots and geo charts created by OmniSci Render. You can also create your own queries in the SQL editor.
Charts
Immerse lets you create a variety of different chart types. You can display pointmaps, heatmaps, and choropleths alongside non-geographic charts, graphs, and tables. When you zoom into any map, visualizations refresh immediately to show data filtered by that geographic context. Multiple sources of geographic data can be rendered as different layers on the same map, making it easy to find the spatial relationships between them.
Create geo charts with multiple layers of data to visualize the relationship between factors within a geographic area. Each layer represents a distinct metric overlaid on the same map. Those different metrics can come from the same or a different underlying dataset. You can manipulate the layers in various ways, including reorder, show or hide, adjust opacity, or add or remove legends.
Use Multiple Sources
OmniSci Immerse can visually display dozens of datasets in the same dashboard, allowing you to find multi-factor relationships that you might not otherwise consider. Each chart (or groups of charts) in a dashboard can point to a different table, and filters are applied at the dataset level. Multisource dashboards make it easier to quickly compare across datasets, without merging the underlying tables.
Streaming Data
OmniSci Immerse is ideal for high-velocity data that is constantly streaming; for example, sensor, clickstream, telematics, or network data. You can see the latest data to spot anomalies and trend variances rapidly. Immerse auto-refresh automatically updates dashboards at flexible intervals that you can tailor to your use case.
Ready to Get Started?
| I want to... | See... |
|---|---|
| Install OmniSci | |
| Upgrade to the latest version | |
| Configure OmniSci | |
| See some tutorials and demos to help get up and running | |
| Learn more about charts in Immerse | |
| Use OmniSci in the cloud | |
| Use SQL to define users, roles, and privileges, and load and export data | |
| See what APIs work with OmniSci | |
| Learn about features and resolved issues for each release | |
| Know what issues and limitations to look out for | |
| See answers to frequently asked questions |
