
Geo Heatmap
The Geo Heatmap displays aggregate values by geographic location.
| Features | Quantity | Notes |
|---|---|---|
| Required Dimensions | 2 | Requires longitude and latitude, or POINT defined by longitude and latitude. OmniSci stores POINT data as longitude first, and then latitude. |
| Required Measures | 1 | Color. |
The Geo Heatmap lets you visually compare information by region.
Geo Heatmap Examples
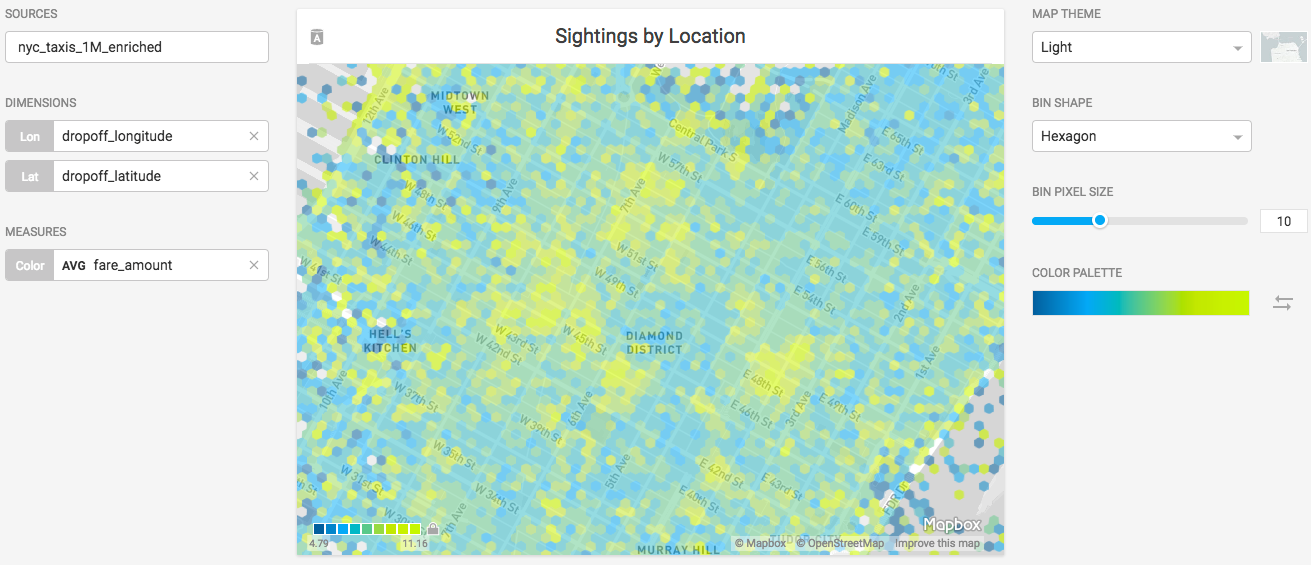
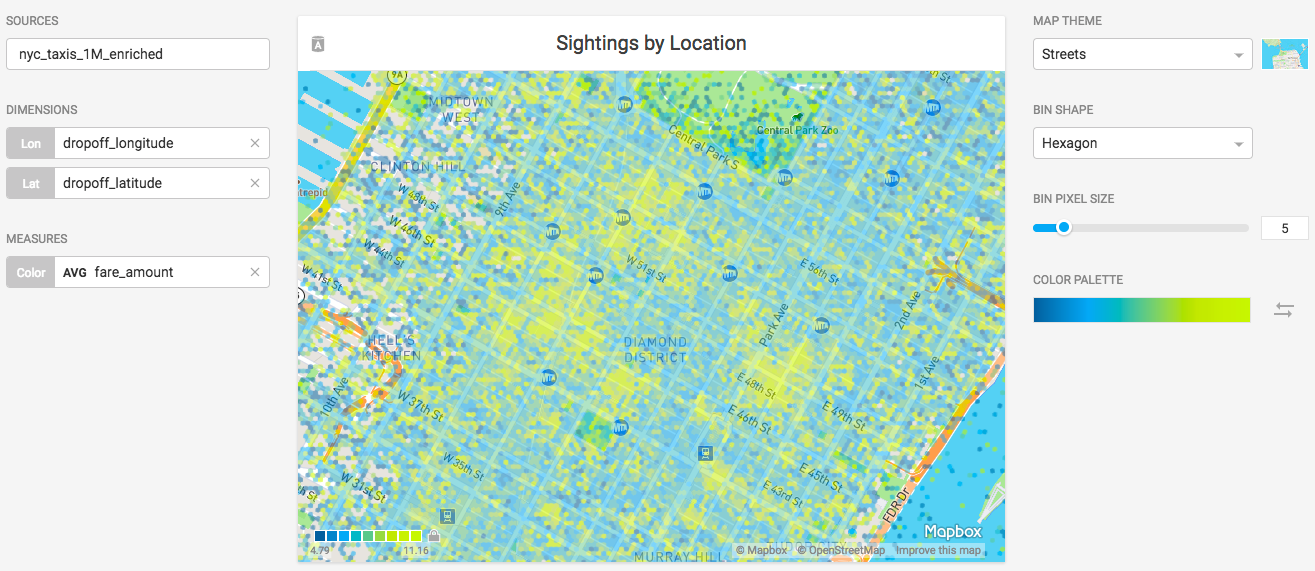
Create a new Geo Heatmap. This example uses the 1 Million Row NYC Taxi database as the Data Source. Set the dimensions to dropoff_longitude and dropoff_latitude. Set the measure to AVG fare_amount.
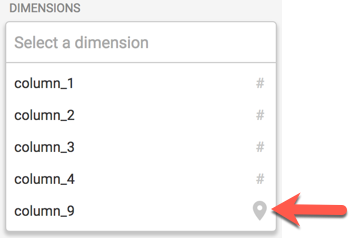
NOTE: You can also use POINT data (generated from longitude/latitude) for LON and LAT; for example, column_9 contains point data:
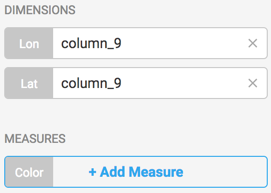
When you select data of type POINT, Lon and Lat are both populated with the values for the point data:
Changing the Map Theme from Light to Streets improves the contrast for the street names.
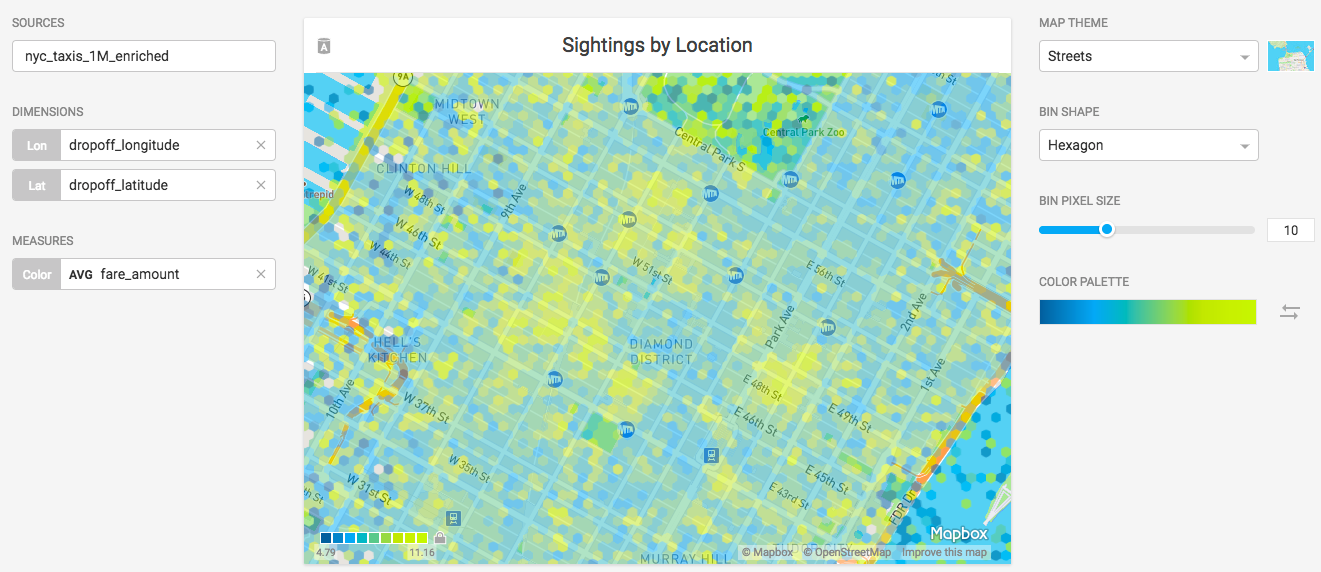
The values displayed on the Geo Heatmap are binned aggregate values. You can choose to display the Bin Shape as hexagons or as squares. You can adjust the Bin Pixel Size of the markers to a smaller size to increase the granularity of the Geo Heatmap.
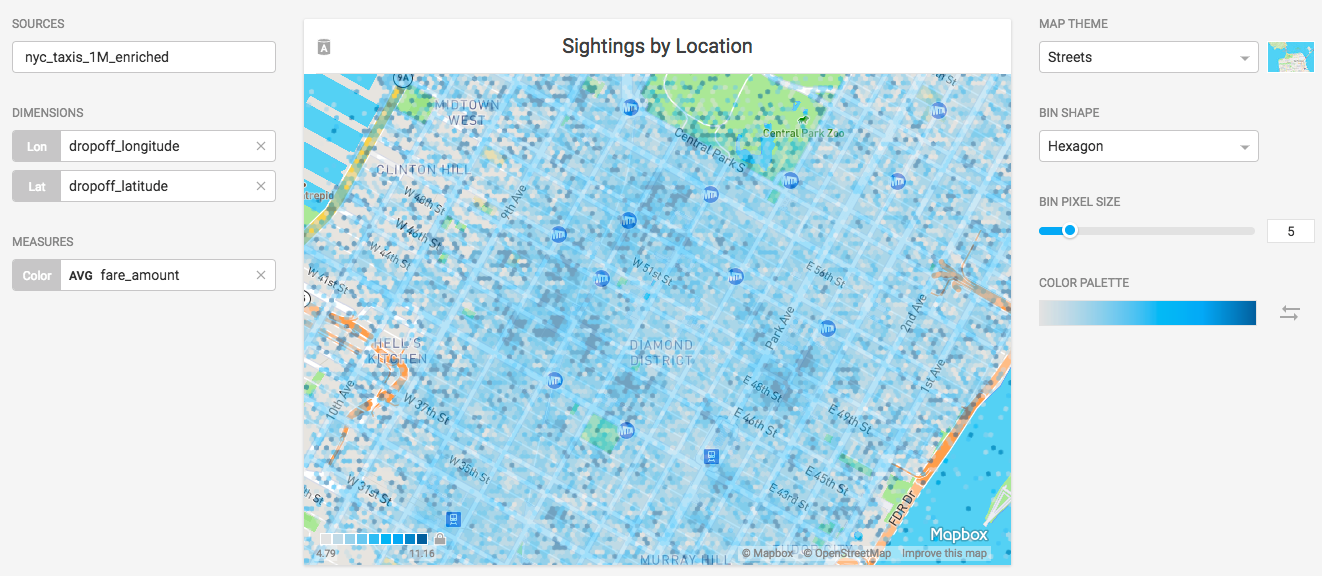
You can set the Color Palette to tell a more effective story with your data. In this example, setting the palette to gradations of blue helps to distinguish between the trees in Central Park versus the fare values.
Multi-layer Geospatial Maps
Pointmap and Geo Heatmap charts can be layered on top of one another to allow visual comparison of datasets. See Creating Multi-layer Geospatial Charts.